Fakta om Pyu
| Område | 1.3 km² |
| Befolkning | 38 881 |
| Manlig befolkning | 18 305 (47.1%) |
| Kvinnlig befolkning | 20 576 (52.9%) |
| Befolkningsförändring (1975 to 2020) | +818.7% |
| Befolkningsförändring (2000 to 2020) | +5.4% |
| Medianålder | 26 år (Män: 24.8, Kvinnor: 27.1) |
| Lokal tid | |
| Tidszon | burmesisk tid |
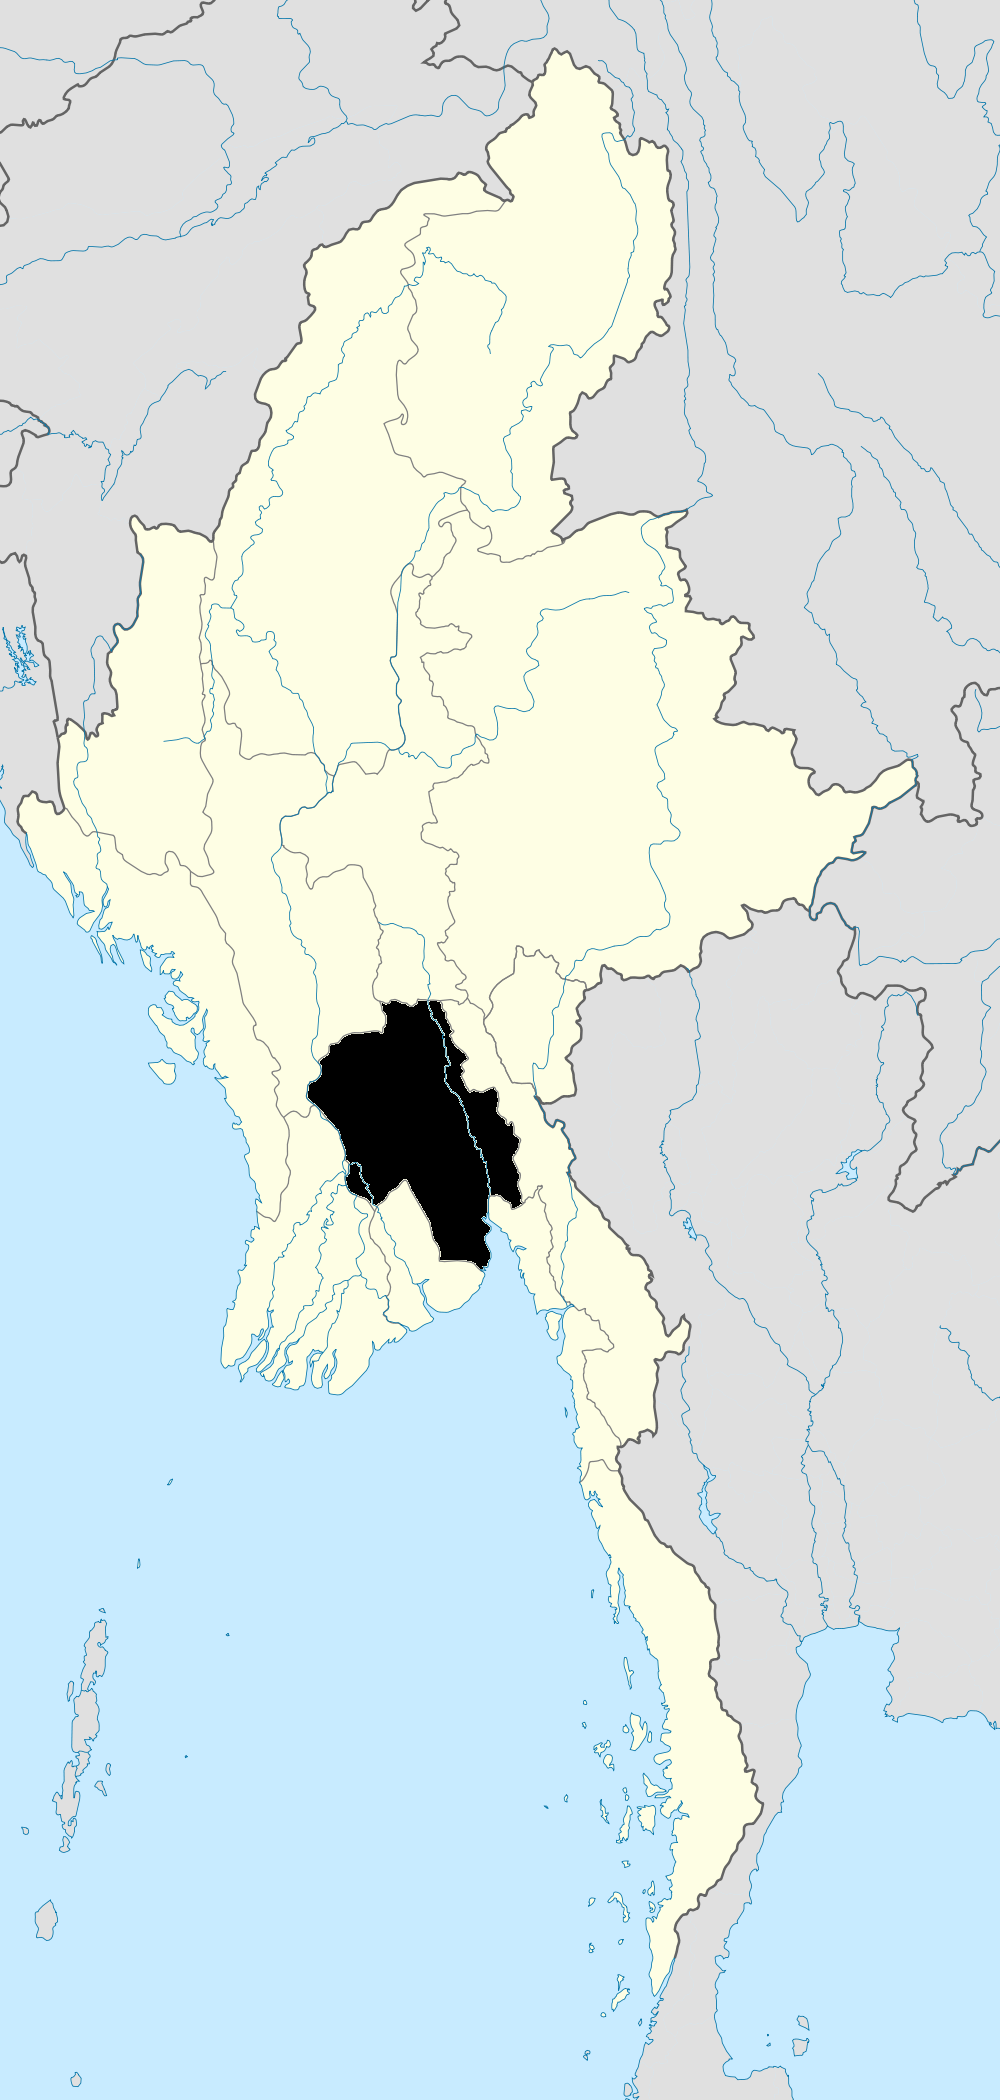
| Lat och lon | 18.48130, 96.43742 |
Karta över Pyu
Interaktiv karta
Befolkning i Pyu
År 1975 till 2020
| Data | 1975 | 1990 | 2000 | 2015 | 2020 |
|---|---|---|---|---|---|
| Befolkning | 4 232 | 23 763 | 36 904 | 37 917 | 38 881 |
| Befolkningstäthet | 3 385,6 / km² | 19 010,4 / km² | 29 523,2 / km² | 30 333,6 / km² | 31 104,8 / km² |
Källor: JRC (European Commission's Joint Research Centre) arbete med GHS built-up grid
Befolkningsförändring i Pyu från 2000 till 2015
Ökning med 2.7% från år 2000 till 2015
| Plats | Förändring sedan 1975 | Förändring sedan 1990 | Förändring sedan 2000 |
|---|---|---|---|
| Pyu | +796% | +59.6% | +2.7% |
| Bago Region | +1229.6% | +117.2% | +26.7% |
| Burma | +73.5% | +27.5% | +12.8% |
Källor: JRC (European Commission's Joint Research Centre) arbete med GHS built-up grid
Medianålder för Pyu
Medianålder: 26 år
| Plats | Medianålder | Medianålder (kvinna) | Medianålder (manlig) |
|---|---|---|---|
| Pyu | 26 yrs | 27.1 yrs | 24.8 yrs |
| Bago Region | 28.2 yrs | 29.3 yrs | 27 yrs |
| Burma | 27.2 yrs | 28.2 yrs | 26.1 yrs |
Källor: CIESIN (Center for International Earth Science Information Network)
Befolkningstäthet i Pyu
Befolkningstäthet: 31 105 / km²
| Plats | Befolkning | Område | Täthet |
|---|---|---|---|
| Pyu | 38 881 | 1,25 km² | 31 105 / km² |
| Bago Region | 5,2 million | 38 788 km² | 134 / km² |
| Burma | 53,1 million | 668 905 km² | 79,4 / km² |
Källor: JRC (European Commission's Joint Research Centre) arbete med GHS built-up grid
Historisk och prognostiserad befolkning för Pyu
Uppskattad befolkning från 1840 till 2100
Källor:
- JRC (European Commission's Joint Research Centre) arbete med GHS built-up grid
- CIESIN (Center for International Earth Science Information Network)
- [Länk] Klein Goldewijk, K., Beusen, A., Doelman, J., and Stehfest, E.: Anthropogenic land use estimates for the Holocene – HYDE 3.2, Earth Syst. Sci. Data, 9, 927–953, https://doi.org/10.5194/essd-9-927-2017, 2017.
Prisfördelning
Fördelning av verksamhet efter pris för Pyu
Human Development Index (HDI)
Statistiskt sammansatt index för livslängd, utbildning och inkomst per capita.
Källa: [Länk] Kummu, M., Taka, M. &Guillaume, J. Gridded global datasets for Gross Domestic Product and Human Development Index over 1990–2015. Sci Data 5, 180004 (2018) doi:10.1038/sdata.2018.4
CO2-utsläpp i Pyu
Koldioxidutsläpp per capita i ton per år
| Plats | CO2-utsläpp | CO2-utsläpp per capita | CO2-utsläppsintensitet |
|---|---|---|---|
| Pyu | 8,192 tn | 0.21 tn | 6,553.4 tons/km² |
| Bago Region | 1,099,837 tn | 0.21 tn | 28.4 tons/km² |
| Burma | 11,664,181 tn | 0.22 tn | 17.4 tons/km² |
Källor: [Länk] Moran, D., Kanemoto K; Jiborn, M., Wood, R., Többen, J., and Seto, K.C. (2018) Carbon footprints of 13,000 cities. Environmental Research Letters DOI: 10.1088/1748-9326/aac72a
CO2-utsläpp i Pyu
| CO2-utsläpp 2013 (ton/år) | 8,192 tn |
| CO2-utsläpp 2013 (ton/år) per capita | 0.21 tn |
| CO2-utsläppsintensitet 2013 (ton/km²/år) | 6,553.4 tons/km² |
Naturliga risker
Relative risk out of 10
| Fara | Risk Level |
|---|---|
| Drought | High (10) |
| Earthquake | Medium (6) |
* Risk, particularly concerning flood or landslide, may not be for the entire area.
Källor:
- Dilley, M., R.S. Chen, U. Deichmann, A.L. Lerner-Lam, M. Arnold, J. Agwe, P. Buys, O. Kjekstad, B. Lyon, and G. Yetman. 2005. Natural Disaster Hotspots: A Global Risk Analysis. Washington, D.C.: World Bank. https://doi.org/10.1596/0-8213-5930-4.
- Center for Hazards and Risk Research - CHRR - Columbia University, Center for International Earth Science Information Network - CIESIN - Columbia University, and International Research Institute for Climate and Society - IRI - Columbia University. 2005. Global Drought Hazard Frequency and Distribution. Palisades, NY: NASA Socioeconomic Data and Applications Center (SEDAC). https://doi.org/10.7927/H4VX0DFT.
- Center for Hazards and Risk Research - CHRR - Columbia University, Center for International Earth Science Information Network - CIESIN - Columbia University. 2005. Global Earthquake Hazard Distribution - Peak Ground Acceleration. Palisades, NY: NASA Socioeconomic Data and Applications Center (SEDAC). https://doi.org/10.7927/H4BZ63ZS.
Nya jordbävningar i närheten
Magnitude 3.0 och högre
| Datum▼ | Tid↕ | Magnitude↕ | Distance↕ | Djup↕ | Plats↕ | Länk |
|---|---|---|---|---|---|---|
| 6/18/19 | 4:28 AM | 4.8 | 72.5 km | 16,190 m | 41km ENE of Letpandan, Burma | usgs.gov |
| 1/28/19 | 3:52 AM | 4.5 | 46.2 km | 27,660 m | 45km SW of Pyu, Burma | usgs.gov |
| 10/4/18 | 1:29 PM | 4.5 | 94.6 km | 10,000 m | 46km S of Pyinmana, Burma | usgs.gov |
| 9/8/18 | 11:36 AM | 4.5 | 97.7 km | 10,000 m | 60km ENE of Prome, Burma | usgs.gov |
| 6/17/18 | 1:42 PM | 4.6 | 33.5 km | 10,000 m | 33km WSW of Pyu, Burma | usgs.gov |
| 6/17/18 | 1:21 PM | 5 | 45 km | 10,000 m | 44km WSW of Pyu, Burma | usgs.gov |
| 4/24/18 | 12:23 PM | 5.1 | 34.1 km | 10,000 m | 33km WSW of Pyu, Burma | usgs.gov |
| 4/22/18 | 6:31 PM | 4.9 | 49.9 km | 10,000 m | 49km WSW of Pyu, Burma | usgs.gov |
| 4/21/18 | 10:41 PM | 4.7 | 39 km | 10,000 m | 38km WSW of Pyu, Burma | usgs.gov |
| 4/20/18 | 10:29 PM | 5 | 34.2 km | 17,070 m | 33km WSW of Pyu, Burma | usgs.gov |

Om våra data
Uppgifterna på denna sida uppskattas med hjälp av en rad offentligt tillgängliga verktyg och resurser. De tillhandahålls utan garanti och kan innehålla felaktigheter. Använd på egen risk.